Boulder’s budget (mostly) recovered from COVID cuts

Saturday, Oct. 16, 2021
Boulder’s budget has mostly recovered from the deep cuts the pandemic forced on the city, cuts that slashed staff and shuttered services. More than $9.4 million was allocated for restoring services and jobs, as staff are “cautiously optimistic about improving conditions,” City Manager Nuria Rivera-Vandermyde wrote in an introduction to the spending plan.
There are new programs and services in the budget, too: More than $8 million worth. They include hires to implement the city’s racial equity plan and renter assistance program, grants to help owners of affordable homes with HOA costs, and expansion of emergency response services in the fire department, among others.
More details on restored and new services, spending and staff
Some restoration began in 2021, with council adding $1.4 million back in personnel halfway through the year after revenue exceeded projections. They also allocated $2.7 million to hire additional police and utilities staff focused on the removal and deterrence of unhoused people from public spaces. Police are still the city’s largest single source of spending, excluding utilities, and the largest department by employees, even with dozens of vacant officer positions due to retirements and resignations.
Other departments are short on staff, too, still not fully restored to pre-pandemic levels. The library, which sustained heavy cuts, is 70-75% of the way back to normal, director David Farnan said during a first readingThe beginning of the process that codifies an ordinance; it’s the first opportunity for council to... of the budget. Planning and development will be fully staffed by March of 2022, according to director Jacob Lindsey.
“We lost more staff than we requested,” Lindsey said. “We requested what our fund and the general fund can pay for.”
The economic recovery is anticipated to continue. Sales tax is expected to increase by $4.5 million, or 8% over 2021, and come out slightly above pre-pandemic levels. That would put Boulder’s general fund revenue 1.6% above where it was in 2019.
“It’s pretty much flat,” Senior Budget Manager Mark Woulf said of the city’s 2022 spending plan, “which means we’re slightly behind. We’re not quite back to where we want to be.”
Council did not recommend any changes to the budget when it was presented Sept. 28. They will take another look on Tuesday, Oct. 19, with a public hearingScheduled time allocated for the public to testify or share commentary/input on a particular ordinan.... By law, the budget has to be adopted by Dec. 1.
Here’s a look at the highlights of the 2022 budget, including key comparisons to 2019 spending. Because of COVID impacts, this will give a better sense of trends than comparing 2022 to last year’s spending.
Note: Some calculations were done by city staff; others by Boulder Beat, with in put and guidance from finance staff. Staff analysis considers more factors, including information not available to the public, and is therefore more accurate. However, Boulder Beat is presenting additional data in an attempt to demonstrate where Boulder’s money is going and how it compares to pre-pandemic spending.
$462,518,802 total budget
1,460.71 full-time employees (FTE)
- Operating: $300,093,670 (65%)
- Capital: $162,425,132 (35%)
The operating budget is money that goes to keeping the city running, paying salaries and funding programs, etc. Capital spending is the money that goes for one-time projects, like building new or improving existing physical assets. As such, the operating budget is more important to understand Boulder’s spending year-over-year.
$300.1M operating budget
- General fund: $134,145,347
- Dedicated funds: $169,948,323
$162.4M capital budget
- Gov’t capital fund (general): $11,986,176
- Dedicated funds: $150,438,956
Boulder has even fewer discretionary dollars today than before the pandemic. 69.3% of the overall 2022 budget is dedicated, meaning those dollars are tied to specific departments, programs and/or services. In 2019, 57.8% of the budget was dedicated.
Read more: Siloed spending limits Boulder’s options
2019-2022 overall spending comparisons
These figures are not adjusted for inflation
Overall budget: Up by $109 million or 31%
FTE: Up by 16.59 FTE, or 1%
- Operating budget: Up by $17.2 million or 6.1%
- Capital budget: Up by $92 million or 130%
Capital spending — on Boulder’s physical assets like roads, bridges, buildings, waterways, etc. — fluctuates greatly from year to year, depending on what projects are being undertaken. Capital spending increased significantly ($92.32 million) in 2022 due mostly to debt borrowed for three big utilities projects:
- Major main sewer line realignment from Valmont to the Water Resource Recovery Facility ($44.5 million)
- Water treatment facility improvements at Betasso and 63rd St. ($29 million)
- Albion Dam improvements ($9.87 million)
Spending by department (excluding utilities)
- 14% Transportation – $41,851,487
- 14% Police – $40,486,348
- 11% Open Space and Mountain Parks (OSMP) – $30,990,582
- 10% Internal services – $28,690,975
- 10% Parks & rec – $28,189,667
- 8% Fire dept – $23,420,511
- 8% Housing and Human Services (HHS) – $22,489,063
- 5% Planning and development – $14,203,911
- 5% General governance – $13,862,456
- 4% Community vitality – $12,991,653
- 4% Library and arts – $11,971,107
- 4% Facilities and fleet – $10,580,506
- 2% Climate initiatives – $6,373,015
- 1% Municipal court – $2,219,372
Internal services and general governance cover multiple departments, such Human Resources, the city attorney and manager’s office, finance, tech — all the things you need to keep an organization running. General governance also includes any money the city has borrowed to undertake large projects.
Why do we exclude utilities?
As in this story, spending is presented typically excluding utilities. That’s because this department largely pays for itself through fees charged on services. In other words, it’s somewhat unfair to include utilities in a list of things the city spends money on, since the money going to utilities also comes from utilities. It skews the numbers: Utilities is our single biggest “expenditure,” with a budget of $174 million, or 38% of all city dollars, and has the second-biggest staff (178.57 FTE) behind the police department.
2019-2022 operating budget comparisons
Compounded annual growth rate of spending by department, as calculated by city staff
- City council: 26.8%*
- Innovation and tech: 4.3%**
- Communications and engagement: 3.8%
- Community vitality: 3.6%
- Library and arts: 2.8%
- Municipal court: 2.8%
- Police: 2.6%
- Finance: 2%
- Parks & rec: 1.7%
- Fire: 1.5%
- City attorney’s office: 1.4%
- City manager’s office: 1.4%
- Transportation: 1.3%
- OSMP: 0.2%
- Planning and development: 0.1%
- Facilities and fleet: -0.1%
- HHS: -1.4%
- Climate initiatives: -10.8%***
Average across all departments: 2.3%
*City council added a full-time assistant between 2019 and 2022, and benefits for council members were approved by voters. That added $210,000 to the council’s operating budget, which in 2019 was $226,744 and in 2022 will be $426,034.
*The IT department increased ongoing funding by $1 million in 2022 due to new staff and systems, as well as a one-time spend of $400K for an updated record management system and related debt.
***The decrease in climate initiatives spending is mostly related to the ending of the muniA utility that would be owned by the city of Boulder. Shorthand for municipalization, which is the p...; spending has shifted to special projects in partnership with XcelXcel Energy, a publicly traded utility company based in Minnesota. ($2.1 million in 2022) versus the $5.2 million spent on municipalization in 2019.
Several other departments had large projects and/or other changes that impacted budget comparisons year-over-year. Those were excluded from the figures above, but are listed below, along with the unadjusted compounded annual growth rate.
- City manager’s office: 12%
– 2019 spending was nearly $1 million under due to vacancies and operational savings. Two new jobs were added to the office between 2019 and 2022: the independent police monitor and an equity position. - Finance: 5%
– A new sales tax system, costing $500K, was implemented in 2020 (included in the 2019 budget) - HHS: -14.2%
– 2019 included a large one-time spend of $12.3 million for 30Pearl
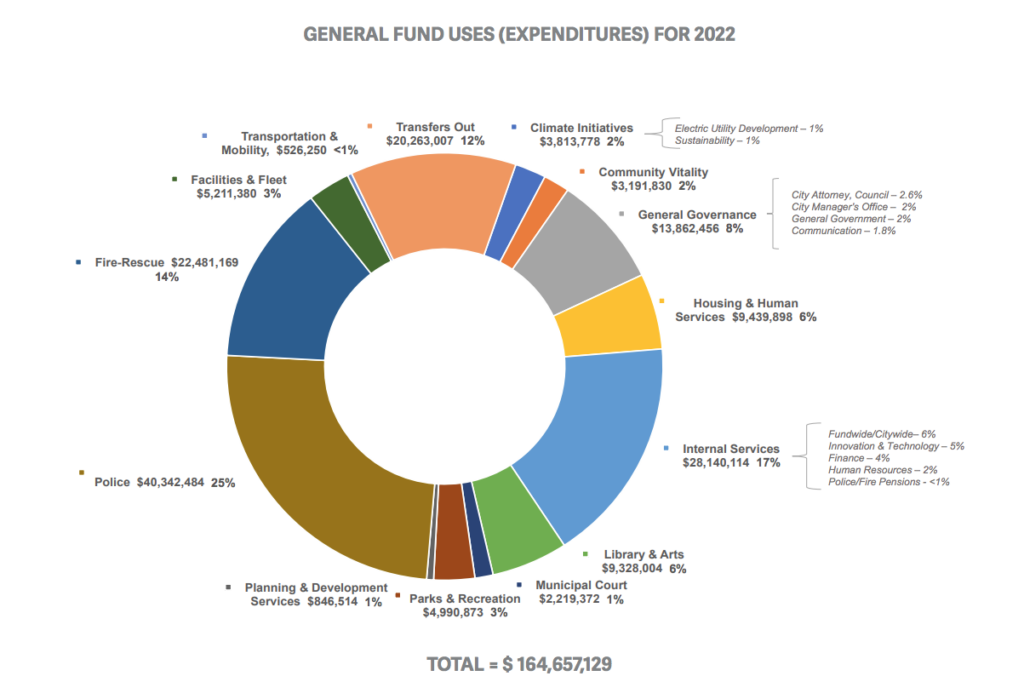
General fund spending
The general fund is the city’s largest and only truly discretionary pot of money; that is, funds that can be spent on almost anything and shifted around at the will of council or staff. Most of the city’s basic functions (outside of utilities) are paid for from the general fund, including police, fire and courts as well as all the administrative functions of a large organization.
Areas where the share of general fund increased between 2019 and 2022, as analyzed by Boulder Beat, are shown in green; a decreased share is noted by red text. Black or gray text indicates no change. It should be noted that planning, transportation and facilities and fleet were all restructured between 2019 and 2022.
- 25% Police – $40,342,484
- 17% Internal services – $28,140,114
- 14% Fire – $22,481,169
- 8% General governance – $13,862,456
- 6% HHS – $9,439,898
- 6% Library and arts – $9,328,994
- 3% Facilities and fleet – $5,211,380
- 3% Parks & rec – $4,990,873
- 2% Climate initiatives – $3,813,778
- 2% Community vitality – $3,191,830
- 1% Municipal court – $2,219,372
- 1% Planning and development – $846,514
- <1% Transportation – $526,250
Again, transportation, planning and facilities and fleet were restructured between 2019 and 2022. Future year comparisons should be more accurate.
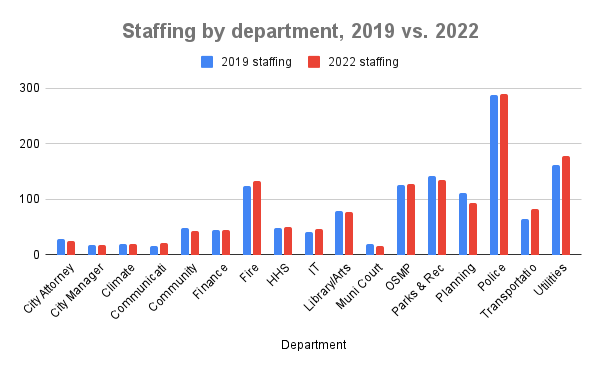
Staffing
Full-time employees by department (and % of total city staff)
- Police: 288.9 FTE (19.8%)
- Utilities: 178.57 (12.2%)
- Parks & rec: 134 (9.2%)
- Fire: 133 (9.1%)
- OSMP: 127.35 (8.7%)
- Planning and development: 92.36 (6.3%)
- Transportation and mobility: 81.52 (5.6%)
- Library & arts: 77.5 (5.3%)
- HHS: 49.1 (3.4%)
- IT: 46.5 (3.2%)
- Finance: 45 (3.1%)
- Community vitality: 41.88 (2.9%)
- HR: 24 (1.6%)
- City attorney’s office: 24 (1.6%)
- Communication: 20.5 (1.4%)
- Climate initiatives: 19 (1.3%)
- City manager’s office: 17.73 (1.2%)
- Municipal court: 16.35 (1.1%)
Note: The city manager’s office and city clerk’s office combined in 2021. City clerk staffing in 2019 was added to the city manager’s FTE for the purposes of this calculation.
Staffing changes, 2019-2022
Several departments were restructured between 2019 and 2022, making direct comparisons difficult. Boulder Beat used all available information, including 2019, 2020 and 2022 budgets, to make the best comparisons possible.
All departments that underwent structural changes are noted with an * Departments where staffing decreased are shown in red; increases are denoted in green.
Change in FTE (and % increase/decrease)
- *Communication and engagement: 5.25 FTE (34.4%)
- *Transportation: 16.92 (26.20%)
- IT: 4.75 (11.4%)
- *Utilities: 17.67 (11%)
- Fire: 9 (7.3%)
- Finance: 1 (2.3%)
- OSMP: 2 (2.3%)
- HHS: 0.53 (0.8%)
- Police. 0.65 (0.2%)
- HR: No change
- Library/arts: -1 (-1.3%)
- *City manager’s office: -0.27 (-1.5%)
- Climate initiatives: -0.75 (-3.8%)
- Parks & rec: -7.5 (-5.3%)
- Municipal court: -2 (-10.9%)
- Community vitality: -5.36 (-11.4%)
- City attorney’s office: -4 (-14.3%)
- *Planning and development: -19.23 (-17%)
Restored services, staff
$9,410,000
- Parks & rec: $1,369,260
- OSMP: $1,301,000
- Library & arts: $1,157,547
- Transportation: $353,000
- Planning and development: $263,400
- HHS: $206,700
- Communications/engagement: $174,658
34 FTE
- 10.25 to library/arts
- 7.5 to planning & development
- 7.25 to parks & rec
- 2.5 to police
- 2 to tech
- 1 each to finance, communications, climate initiatives, city manager/clerk
- 0.5 to HHS
New spending, staff in 2022
$8,175,000
- HHS: $1,337,415
- Parks & Rec: $453,500
- IT: $275,500
- City manager/clerk: $253,000
- Transportation: $250,000
- Fire-rescue: $241,300
- Planning: $147,600
- Communications/engagement: $127,250
- Finance: $87,800
- Police: $30,000
42.5 FTE
- 10 to utilities
- 4.25 to planning & development
- 4 to OSMP
- 4 to fire rescue
- 3.5 to HHS
- 3 to communications
- 3 to facilities and fleet
- 2.25 to climate initiatives
- 2 to HR
- 1.5 to tech
- 1 each to city manager/clerk, transportation, parks & rec, finance, community vitality
Capital spending in 2022
$157,854,835
Big 2022 projects:
- $1.6M Aquatic Facility Enhancements
- $3M Alpine Balsam Flood Mitigation
- $2M South Boulder Creek Flood Mitigation
- $3M Gregory Creek Flood Mitigation
- $4.85M Pavement Management Program
- $4.7M 28th Street Multi-modal Enhancements Project
- $44.5M Main Sewer Improvements
Spending by department
- 35.9% Wastewater – $56,635,000
- 34.7% Water – $54,805,000
- 11.8% Transportation – $18,630,187
- 5.6% Stormwater/flood – $8,788,567
- 3.5% OSMP – $5,571,000
- 2.9% Facilities & fleet – $4,578,841
- 2.9% Parks & rec – $4,528,000
- 1.3% Community vitality – $2,047,000
- 0.85% Citywide – $1,339,440
- 0.55% Innovation & tech – $867,800
- 0.04% Police – $64,000
Spending by type
- 58.9% Enhancement – $92,930,377
- 34.5% Maintenance – $54,431,011
- 5% New facility/infrastructure – $7,882,743
- 1.1% Land acquisition – $1,700,704
- 0.58% Planning studies – $910,000
More information on capital projects can be found in the 2022 draft budget.
— Shay Castle, @shayshinecastle
Want more stories like this, delivered straight to your inbox? Click here to sign up for a weekly newsletter from Boulder Beat. Help make the Beat better. Was there a perspective we missed, or facts we didn’t consider? Email your thoughts to boulderbeatnews@gmail.com
Budget budget capital projects city council city of Boulder COVID governance HHS housing and human services open space operating budget OSMP pandemic police revenue sales tax spending tax transportation

Note that the bulk of the Capital expenses are water, sewer and wastewater related. The poorly maintained Water Utility became evident after the 2013 floods and even more evident after the 80+% rate increases. When I asked Mayor Weaver at a pubic meeting if he thought the 80+% rate increase and the flood effects were indications of a well run water Utility, he responded “yes”. They will never admit they were wrong.