Homelessness 101: Who, What, When, Where
Tuesday, Aug. 23, 2022 (Some data and graphics were updated Monday, July 31, 2023)
Welcome to Homelessness 101, an explainer series breaking down homelessness in Boulder County and beyond. Here, we’ll explore the demographics, causes of and solutions to homelessness through expert interviews, peer-reviewed research and, most importantly, input from people with lived experience. Their perspective is incorporated throughout the series and has been specifically highlighted in some places.
What is homelessness?
Homelessness is the state of being without a primary residence. That could mean living in a car, a shelter or on the streets — the most visible forms of homelessness. It also includes couch-surfing or living with friends, or sleeping in a hotel/motel; any living situation that is meant to be temporary.
The Department of Housing and Urban Development has several definitions for homelessness that include loss of housing due to domestic violence, pending loss of housing without the resources to secure another home, or exiting residential treatment.
Broadly, homelessness can be defined as the state of being “unstably housed.” In HUD parlance, this is people “who have not had a lease or ownership interest in a housing unit in the last 60 or more days, have had two or more moves in the last 60 days, and who are likely to continue to be unstably housed because of disability or multiple barriers to employment.”*
*This is specifically the HUD definition for families with children or unaccompanied youth (terms we’ll dive into a bit later), but many providers at the state and local level define homelessness this way regardless of who is experiencing it.
Who we talk about when we talk about homelessness
Most of what we talk about when we talk about homelessness in Boulder is single adult homelessness. Further, we often concentrate only on unsheltered adult unhoused individuals, because they are the most (and sometimes only) visible manifestation of a much larger problem.
Adults are by no means the majority of people who experience homelessness. Lots of children and young adults do, too: More than 1,000 per year in Boulder County, according to nonprofits serving these populations and official government counts.
Cycles of homelessness often begin in youth. Studies of unhoused populations in various cities find that up to 50% of homeless adults first became unhoused as teens; this correlation increases when looking just at chronically unhoused individuals.
“The No. 1 contributing factor to chronic adult homelessness is youth homelessness,” said Chris Nelson, CEO of TGTHR.
Learn more about:
- Youth homelessness with TGTHR
- Family homelessness with EFAA
How many people are homeless in Boulder County?
Homelessness is a temporary state of being without stable housing. People are entering into and exiting out of homelessness all the time — something to keep in mind when thinking about when trying to assess how many people are homeless.
There are two ways to think about these numbers: How many are likely to be homeless on a given day, and how many people had a period of homelessness in a given year.
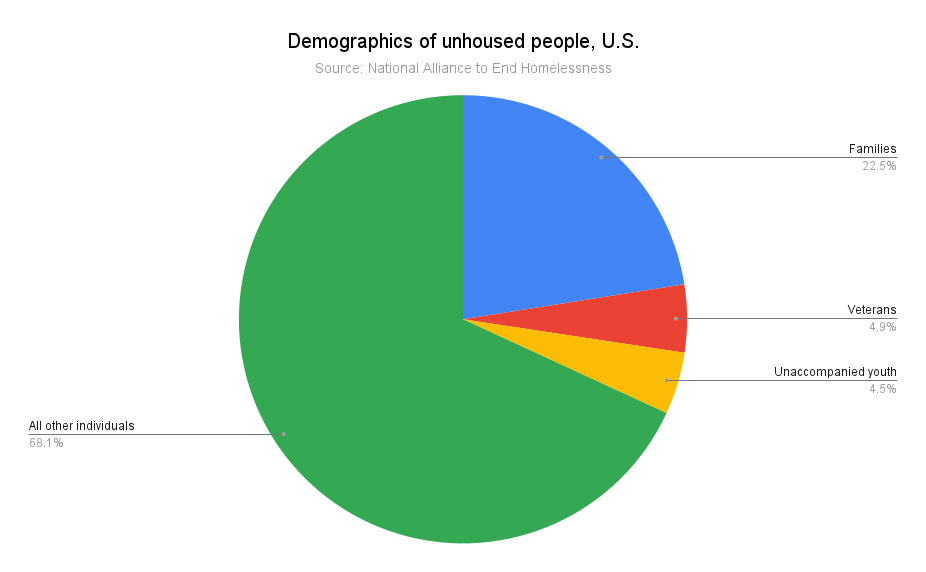
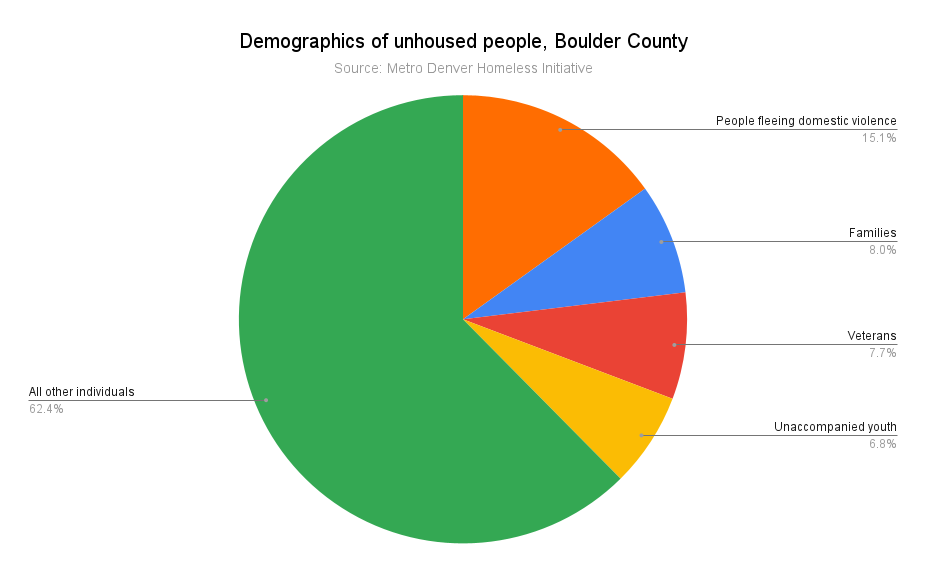
On any given day in Boulder County, roughly 600 people* are experiencing homeless, including
- 104 people fleeing domestic violence
- 55 families (caregivers with at least one child under 18 years of age)
- 53 veterans
- 47 unaccompanied youth (under age 25 without a parent or guardian)
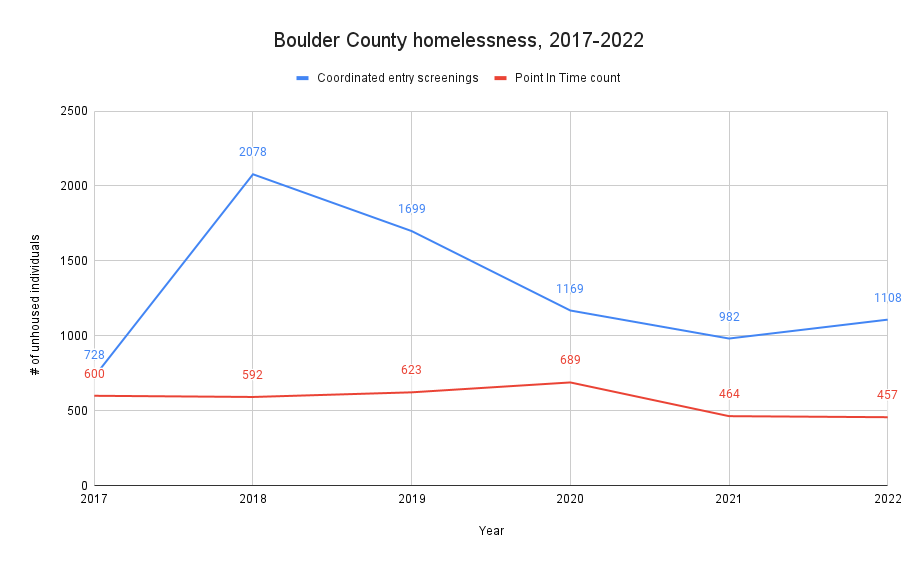
These numbers are likely low. They come from the Point In Time count — a one-day count of people experiencing homelessness, taken in late January in odd years. (Even-year PIT counts are voluntary, and therefore less accurate.) Boulder experiences seasonal fluctuations in homelessness, with increases during the summer. Further, more people may seek shelter during cold winter months, either in official emergency shelter or more secluded outdoor locations, leading to an undercount.
One way to look at who is experiencing homelessness is by those who accessed services over the course of one year. More than 1,300 coordinated entry screenings have been done annually, on average, over the past 5 years. In 2022, 1,108 CE screenings were completed. That doesn’t capture the number of individuals screened, as people may complete CE multiple times. In Boulder, according to the city’s homeless services dashboard, there are three re-screens on average each month.
 Again, this doesn’t capture everyone. A survey of 106 unhoused individuals found that 14% did not complete coordinated entry screening, a figure that is itself likely low. (The same groups who don’t participate in screening may be more likely to be unreached by or uninterested in this survey, though it specifically attempted to reach people who were not engaging in services.)
How many are on the streets vs. in shelter?
In 2023, a summer PIT count showed 839 people experiencing homelessness, the highest number since 2015.
- 408 people in emergency shelter, including hotel rooms paid for by vouchers (49%)
- 188 in transitional housing (22%)
- 243 unsheltered (29%)
There was no count of unsheltered individuals in the 2021 Point In Time survey, due to the COVID-19 pandemic. Additionally, the 2023 PIT number is from the first-ever summer count, when visible homelessness increases.
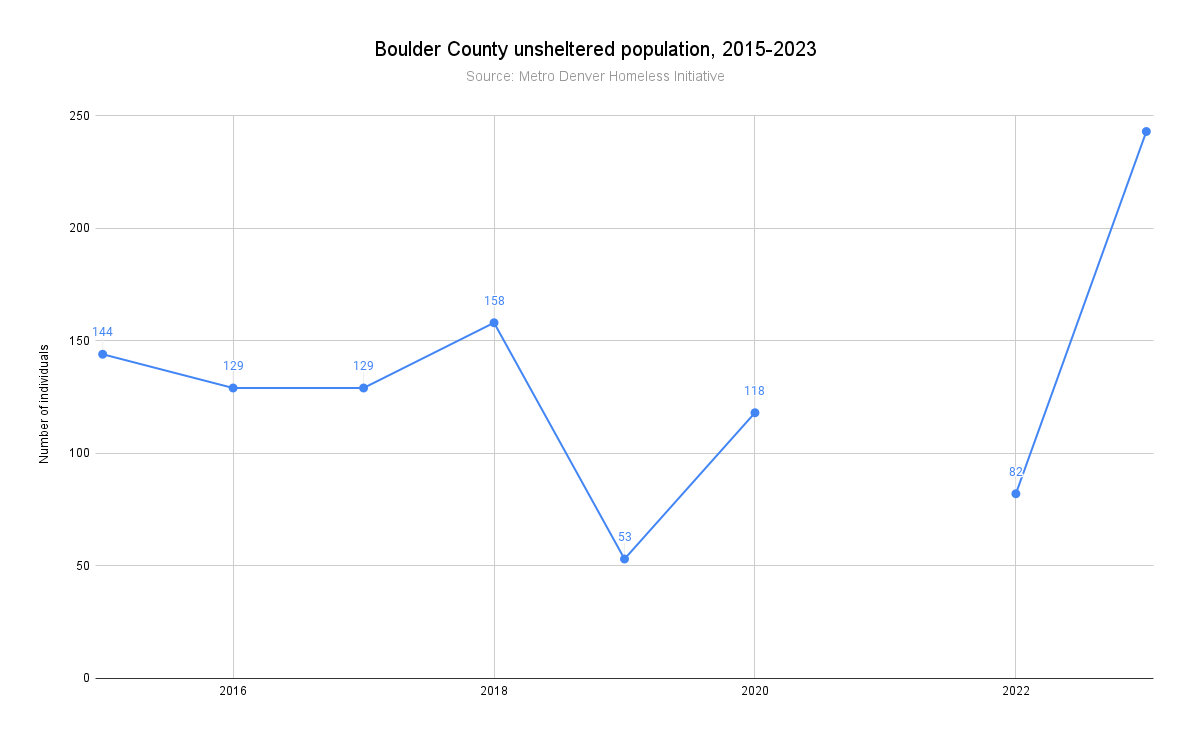
It is unclear why the unsheltered count for 2019 was so low. It has generally stayed between 100-150 in recent years. However, weather data for the day the PIT was taken (Jan. 28, 2019) show temperatures between 10 and 32 degrees. It is possible that more people were seeking shelter when the count was taken, illustrating one of the limits of the PIT.
Who is homeless locally — and who gets left out of official counts?
PIT surveys are reported by providers of emergency shelter and other services.
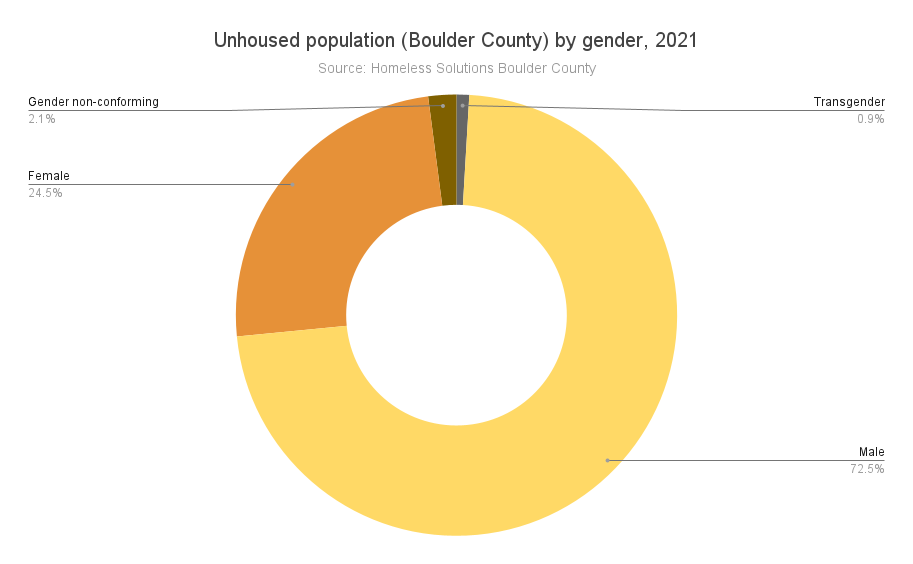
Some groups are undoubtedly left out or under-reported. The numbers of transgender and gender-nonconforming individuals, for instance, seems vastly under-reported, said Shanan Collins, who runs The Lodge, a shelter for women, nonbinary, transgender and other non-cisgender men.
The Lodge hosted 12 transgender individuals between late 2020 and early 2021, about half of their nightly capacity. The PIT counts for that time lists only eight transgender and gender non-conforming individuals total — all in emergency shelter. 2020’s PIT reports no transgender or gender non-conforming individuals living in transitional housing or on the streets.
Collins said that may be due to a reluctance to report gender identity. Gender-nonconforming individuals are victimized at much higher rates than cisgender peers, a risk that only increases when experiencing homelessness.
“I think it’s fear, unfortunately,” Collins said. “I’ve had several individuals come (to The Lodge) and literally crying, saying ‘This is the first place I’ve felt safe and where I felt I could express myself.’ They would dress to the nines in the shelter, and would dress in their cis clothes when they left the shelter.”
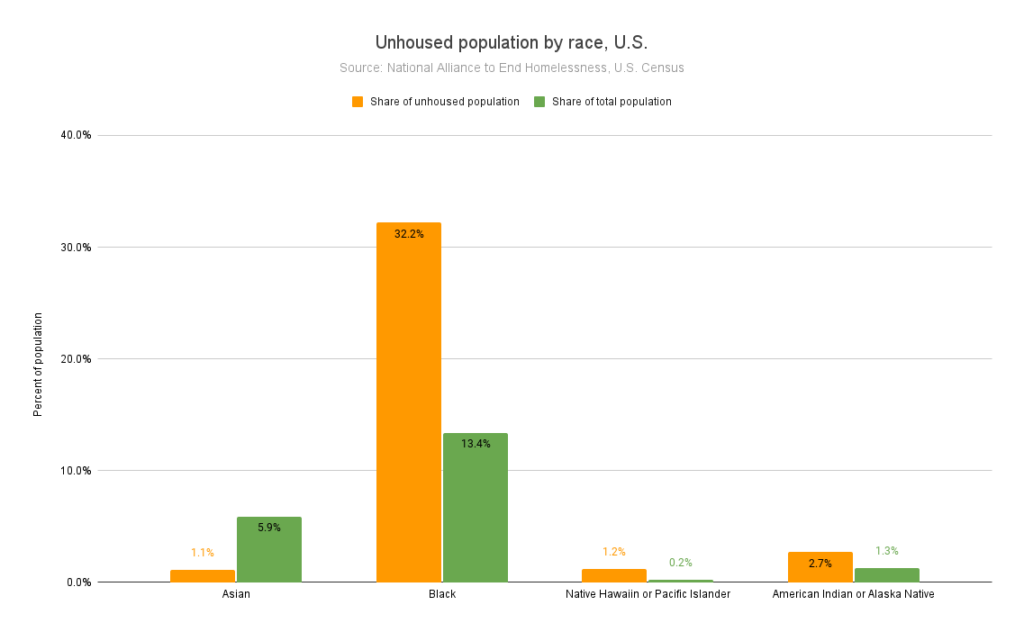
How does Boulder County compare nationally?
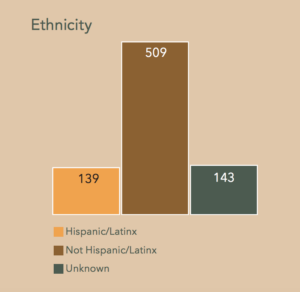
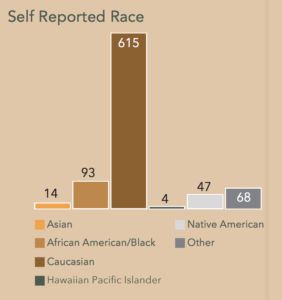
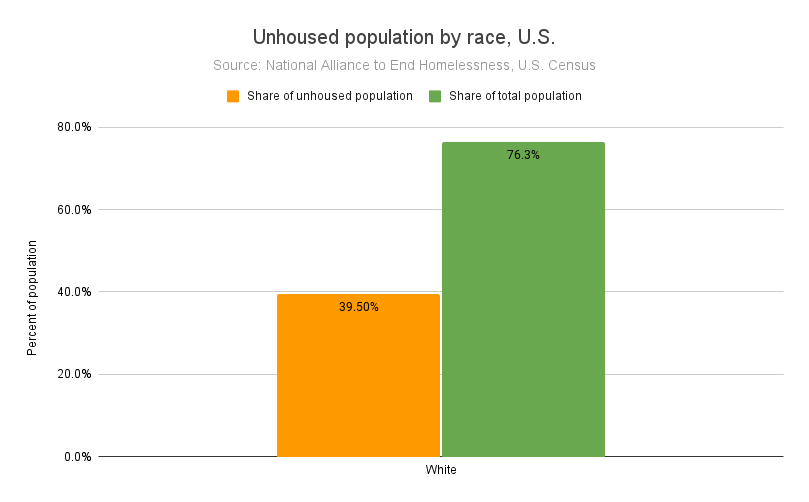
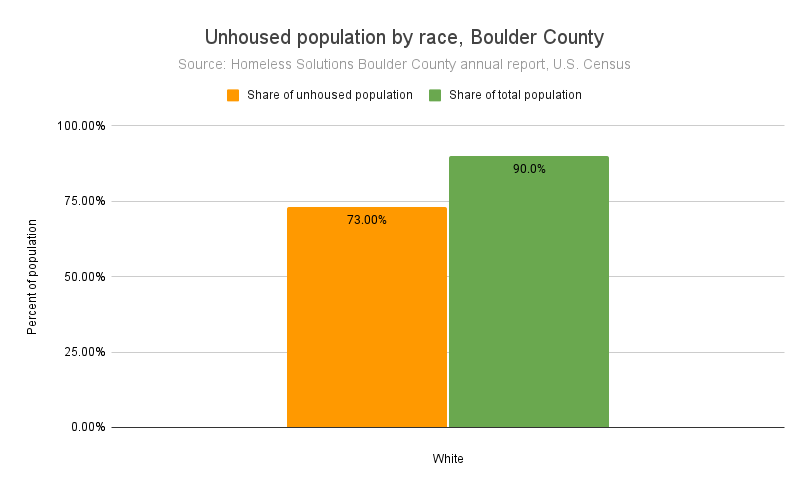
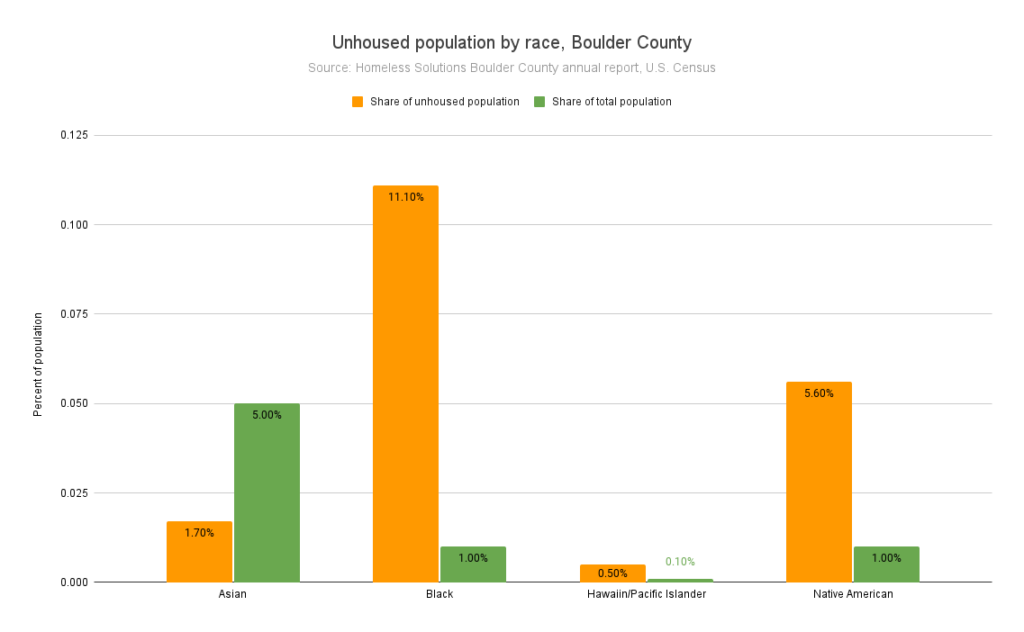
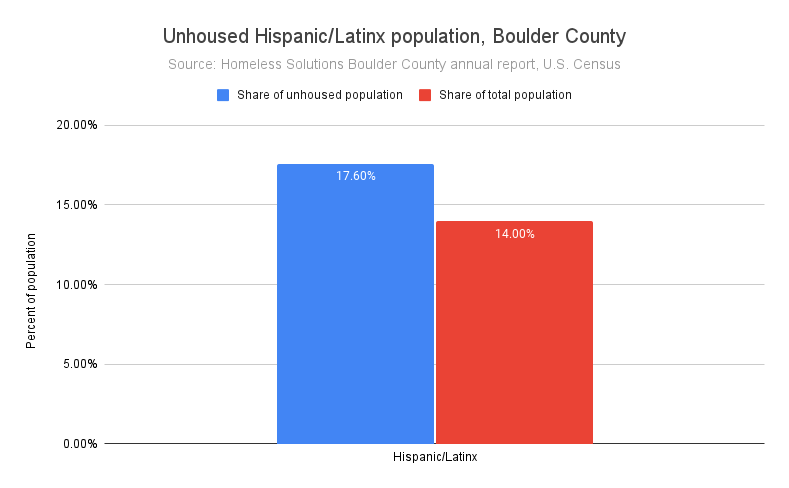
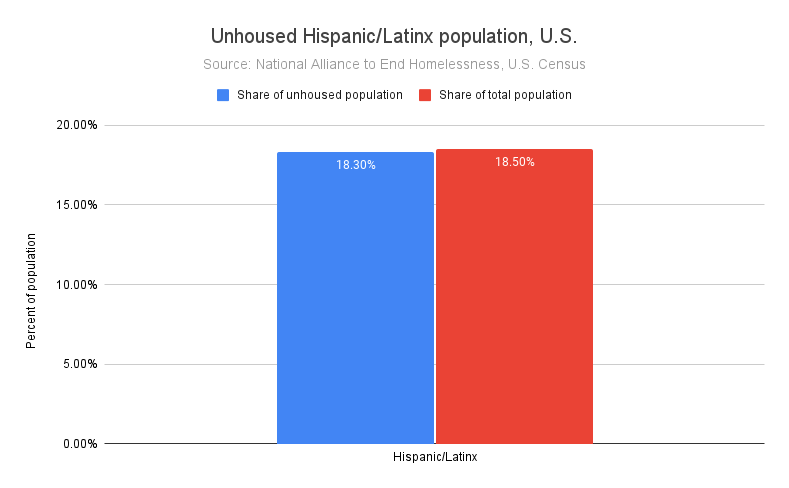
All throughout America, people of color are much more likely to be homeless than white people. Boulder is no different in this respect, as you can see by comparing the share of BIPOC experiencing homelessness relative to their share of the population. Some racial disparities are more pronounced locally: Black and American Indian / Alaskan Native people are far more likely to be unhoused in Boulder Count than elsewhere in the United States, as are Hispanic/Latinx people.
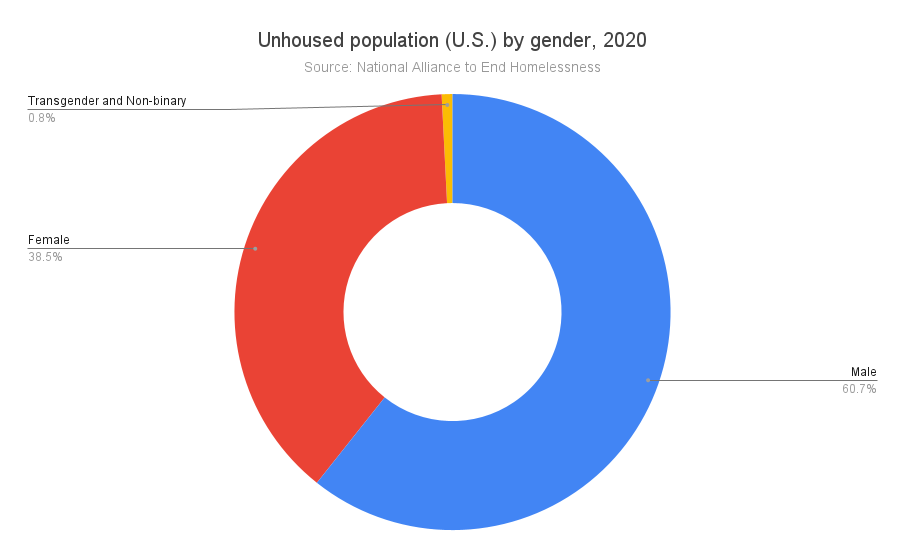
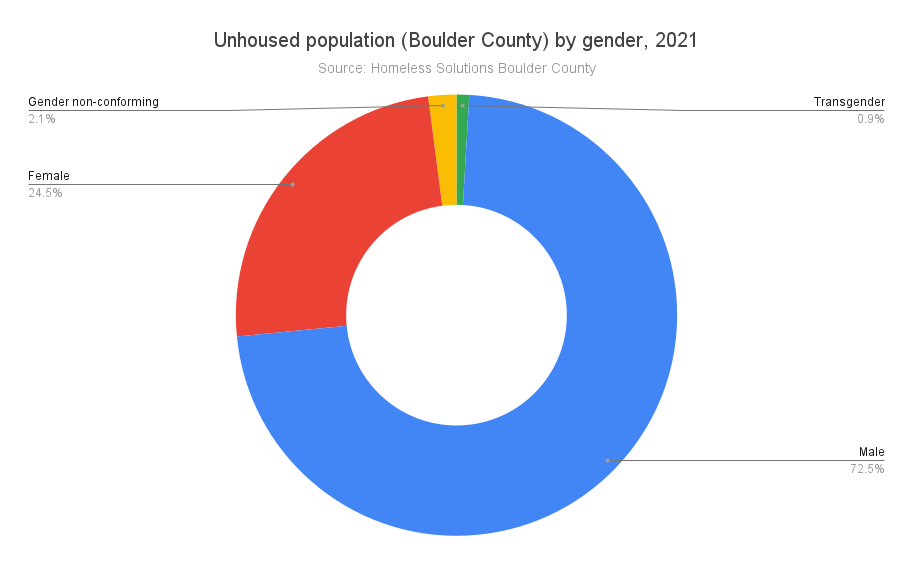
 Transgender, non-binary and other gender-noncomforming individuals also make up a greater share of Boulder County’s unhoused population compared to national trends. That could be due to the fear of disclosing their gender identity in other parts of the country; transgender individuals experience more violence than their cisgender peers, and victimization increases when experiencing homelessness. Non-cisgender people experience homelessness at rates that far exceed their cis-gender peers.
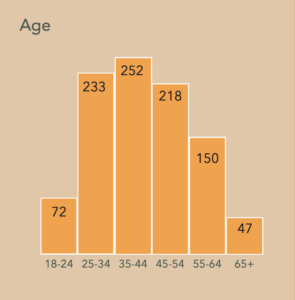
Unaccompanied youth are more likely to experience homelessness in Boulder County than across the nation. This could be explained by Boulder’s relatively young population and the presence of a university and community college in the county.
In 2019, 17% of college students experienced homelessness, and 46% reported housing insecurity.
The University of Colorado does not collect information on students experiencing homelessness; it is establishing a “basic needs center” to help with food and housing, according to a spokesperson.
“While we don’t have specific statistics for students/faculty/staff who may be experiencing homelessness, we recognize that there is more to be done to ensure students experiencing housing insecurity have resources to match the significant amount of work already being done to ensure food security,” Steve Hulbert wrote in response to emailed questions.
The high cost of housing locally may also play a role in higher rates of homelessness for these demographics. We’ll explore this further in an upcoming piece: What causes homelessness? and other FAQ.
— Shay Castle, @shayshinecastle
Help make the Beat better. Was there a perspective we missed, or facts we didn’t consider? Email your thoughts to boulderbeatnews@gmail.com
Want more stories like this, delivered straight to your inbox?
Homelessness affordable housing Boulder city of Boulder coordinated entry family homelessness homeless homeless services Homeless Solutions Boulder County housing Housing and Urban Development Metro Denver Homeless Initiative Point in Time count unhoused unsheltered youth homelessness
Sign up for a weekly newsletter from Boulder Beat.
Homelessness affordable housing Boulder city of Boulder coordinated entry family homelessness homeless homeless services Homeless Solutions Boulder County housing Housing and Urban Development Metro Denver Homeless Initiative Point in Time count unhoused unsheltered youth homelessness