Guest opinion: The data is clear — crime is up in Boulder
Wednesday, April 20, 2022
By Teddy Weverka
Boulder Police last month presented plain information about rising crime. Members of the city council and the April 1 op-ed in this publication called that data into question. The data is solid, and we need to acknowledge the increase in crime in order to prepare a response.
The strongest rejection of the presentation of Boulder’s rising crime rates dismissed the data for lack of error bars, and used the scatter of the data to suggest it is flawed. This attack is misguided. The Boulder Police showed half a dozen graphs of increasing crime. I’ll use one of these graphs to illustrate.
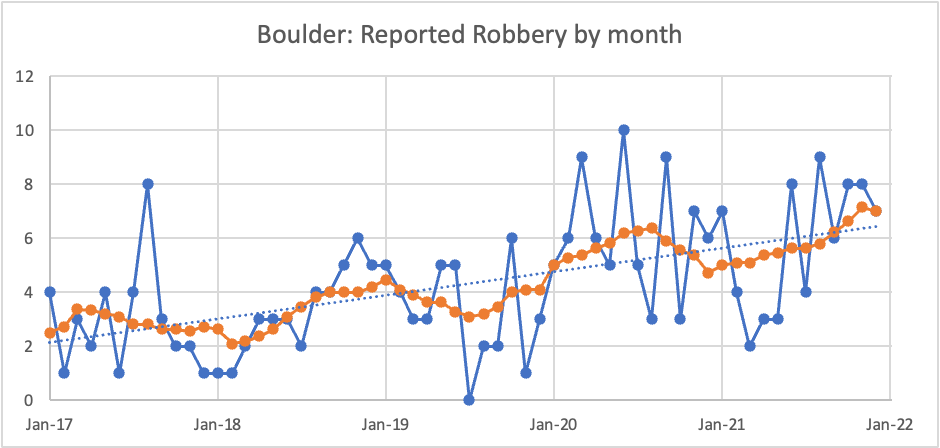
This is the graph presented to city council on robbery by month, minus the orange line — I added that myself to slow the sliding average of that data. (The 12-month average, recomputed each month.) The blue lines are the data the Boulder police presented. The dashed line is the trend line that the police presented.
Error bars are used when measurements are uncertain. We use the size of the error bars to show the range of uncertainty. The Boulder police presented this data on robberies reported to police without error bars. Members of the city council and op-ed authors in this publication called them out for it.
The data the Boulder police presented had no uncertainty. There were exactly 7 robberies reported to police in December of 2021, and there were 8 in each of October and November. There is no uncertainty about the number of robberies reported to the police each month, so there should be no error bars.
The data in the graph shows significant month-to-month fluctuation. This fluctuation does not cast doubt on the data, as a council member suggested. The fluctuation is an intrinsic artifact of counting statistics.
If we set a cup out in a steady rain and count the raindrops that are captured each minute, we won’t get the same count from one minute to the next. The count naturally fluctuates, according to Poisson statistics.
Just as rain drops fall at different rates, crime doesn’t occur at regular intervals: It happens when it happens. There is nothing irregular with the fluctuations in the data presented by the Boulder Police, and these should not be used to throw shade on the data.
Looking at short periods of time makes the data fluctuate more compared to the average. When one looks at crime over a year, the trend line is smoother (as shown in the sliding average added to the graph).
Any way you look at it, robberies are up.
Some of the requests by council members and the op-ed are valuable. They asked for comparisons of these crime rates with other cities; that would add valuable perspective on the rate of crime in Boulder.
Crime is up in Boulder. It is important for the city council to respond appropriately, and I suspect that we may agree on what measures to take in response. But denial of the fact that crime is rising is an improper excuse not to act. Misusing technical jargon to prop up that denial is disconcerting.
Teddy Weverka is a former candidate for CU Regent and has science and engineering degrees from Caltech and CU Boulder
Boulder Beat Opinion Panel members are writing in their own capacity. Their views do not necessarily reflect those of Boulder Beat. Got a different take? Write a Guest Opinion using our op-ed and comment guidelines or submit an application to join the Opinion Panel. Governance Opinion Police Boulder Boulder Police Department city of Boulder crime crime data trends
These opinions do not necessarily reflect the views of Boulder Beat.
Governance Opinion Police Boulder Boulder Police Department city of Boulder crime crime data trends